Chris Kimble shares his expertise on two chart patterns; one in a bull market and one in a bear market. Kimble walks through these two examples and explains why they've formed, but more crucially, what to expect next.
Bull market
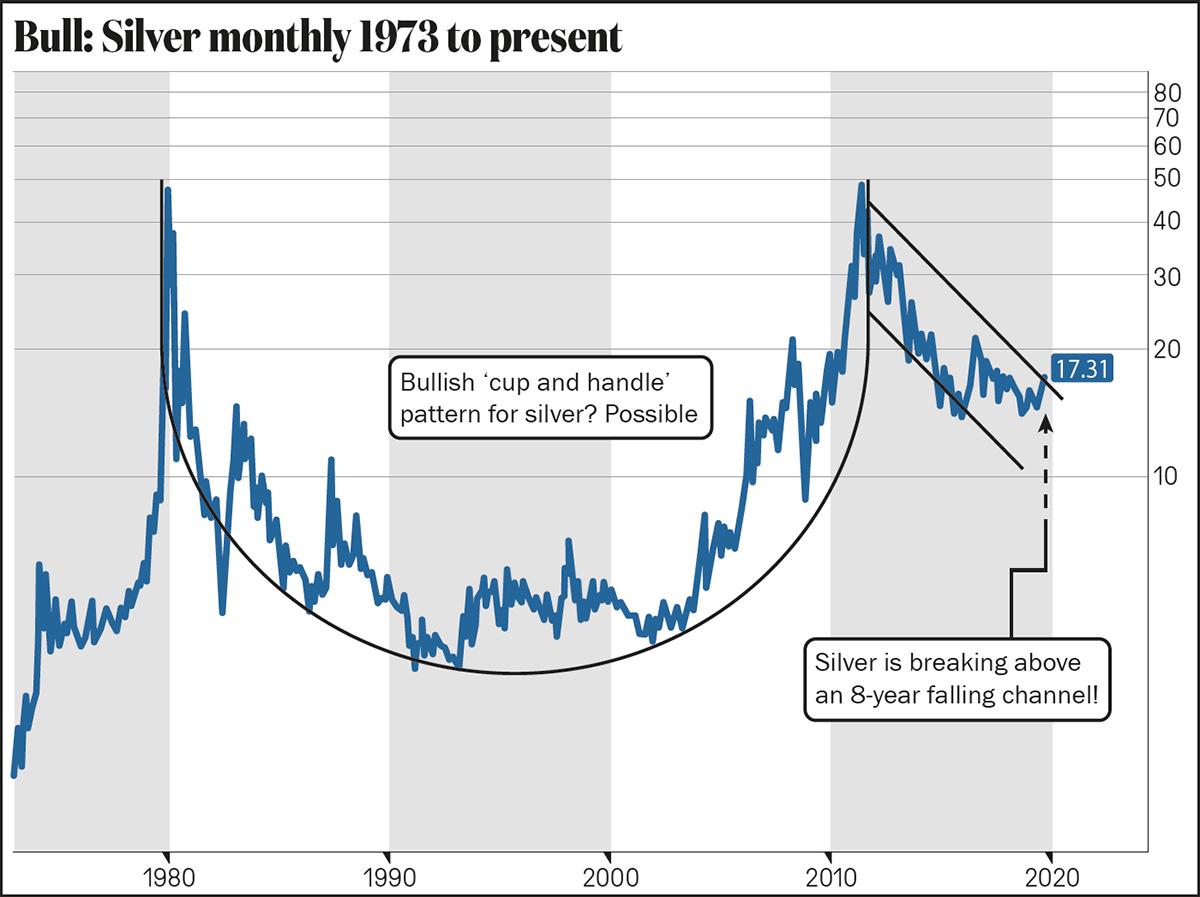
Could silver be forming a bullish cup & handle?

It’s possible. Silver peaked at $50 in the early 1980s and then proceeded to fall for years. It peaked again at $50 in 2011 and has been in decline since then.
The two peaks at the $50 level could be the top of a bullish cup and handle pattern.
One thing is for sure: Silver has been very weak over the past 8 years, having declined by more than 65%, creating a uniform falling channel.
Silver’s recent move higher meanwhile has it breaking above the falling channel (1). For me, this breakout sends a bullish message with the next important resistance test for Silver coming into play at the $17.64 level.
So what would it take for Silver to fully realise a multi-decade bullish cup and handle pattern? A clean break above the $50 level which, it must be noted, is still a long, long way off.
Bear market
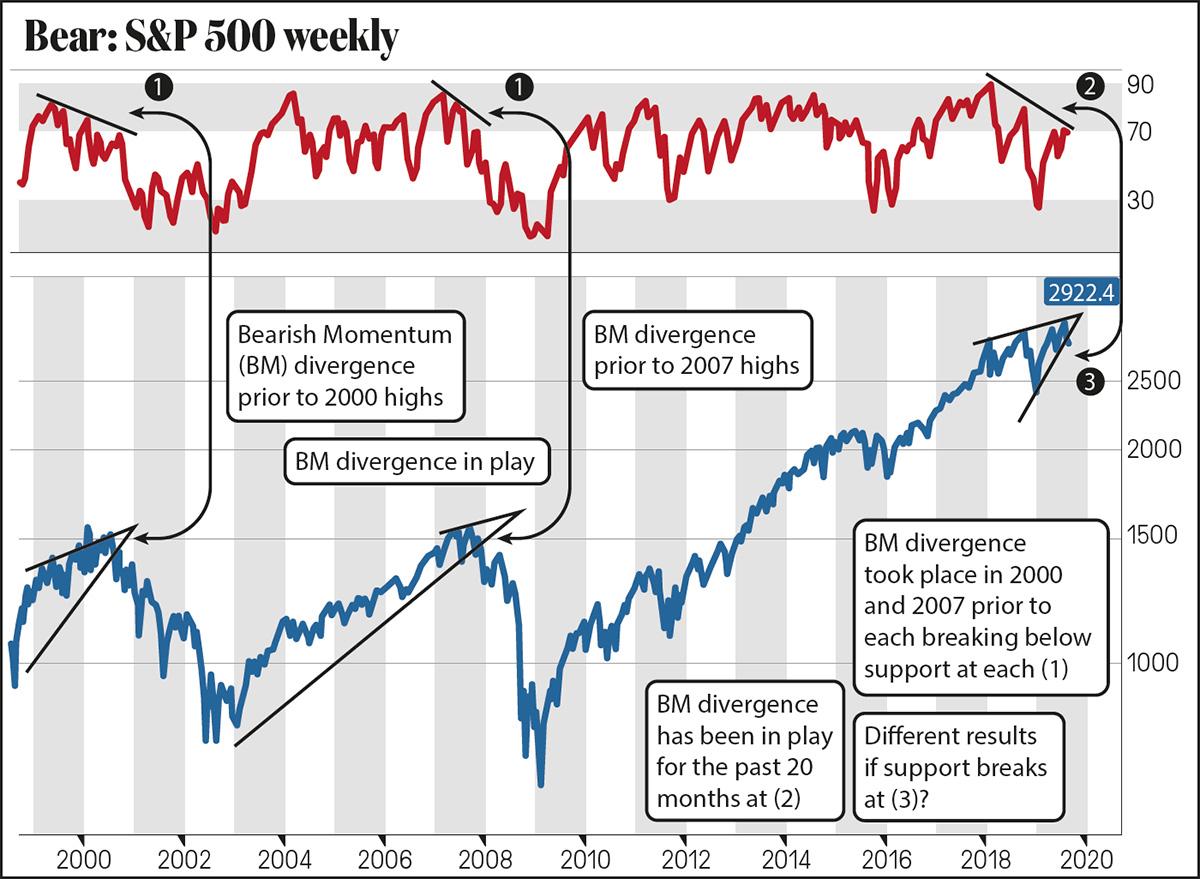
Will a 20-month bearish divergence in the S&P500 impact stocks?

Does history ever repeat itself exactly? No. Do stock market patterns and momentum sometimes look the same? Yes.
This chart looks at the S&P 500 over the past 20-years, on a weekly basis, with momentum in the top section.
In 2000 and 2007, weekly momentum started experiencing a bearish trend and recording lower highs, while the market was creating higher highs at each (1).
Momentum was experiencing a bearish/negative divergence with the S&P 500 on both occasions. Once support broke 2000 & 2007, selling pressure took over.
Over the past 20-months, momentum has created lower highs (2), while the S&P has created higher highs. It's now to be seen whether a similar momentum pattern to the past will be realized. Indeed, the S&P could experience selling pressure if support happens to break (3).
Continue reading for FREE
- Includes free newsletter updates, unsubscribe anytime. Privacy policy


